
andy_moss
/andymoss
I write about charts & trading | Chartered Market Technician, pro trader, 22+ yrs Wall St. experience | simplifying technical analysis | not investment advice
andy_moss
3y ago
What is the #1 Most Important Factor of successful trading?
Do you know what single component of your trading plan will have more impact on results than anything else?
🔹It’s not how smart you are.
🔹It’s not your chart reading skills or some “magic” indicator
🔹It’s not the quality of your fundamental research
🔹It’s not a “Holy Grail” setup.
🔹It’s not how often you’re right or wrong.
✅ It’s how much you make when you’re right and how much you lose when you’re wrong.
That’s it.
💯 Proper position sizing is the most critical factor of successful, profitable trading. 💯
No setup has a 100% win/loss ratio. No system works in all market types.
As traders, we will be wrong. And we will be wrong more often than we are right.
Not many genuinely have a winning percentage of greater than 50%.
Outcomes can vary greatly even in multiple series of trades with identical results.
No one demonstrated that better than Van Tharp and his “marble game.”
@VanTharpInst
"The game works as follows.
🔵 I have a bag of ten marbles.
🔵 Seven marbles are 1R losers.
🔵 One is a 5R loser.
🔵 Two are 10R winners.
The marbles are randomly drawn out of the bag (and replaced) for 30 trades."
"Everyone gets the same trades. After starting with $100,000 the final values can easily range from zero to well over a million dollars.
The only variables important to this game are people’s individual psychology and their position sizing method."
"Your position sizing method produces huge variability in your performance."
-The Definitive Guide to Position Sizing by Van Tharp page 103
https://twitter.com/Andy__Moss/status/1591487997257863168
🤔 Think about that. 🤔
🔹 The same 30 trades.
🔹 The same opportunities for profit and loss.
🔹 Some make millions.
🔹 Some go broke.
So as you continue to learn and improve;
🔹Study the markets
🔹Study yourself
🔹Refine your system
🔹Perfect your execution
But as you work on all that, make sure to spend time learning and improving your position sizing as well.
Getting it right could be the difference between
💵 💵 making millions
❌ ❌ or going broke.
For more lessons and market analysis like and retweet this thread.
And subscribe here
andy_moss
3y ago
Weekend Market Review December 11, 2022
A quick thread to help you prepare for the week.
❓What are the charts telling you?
❓What is the market waiting for?
❓What is the bullish and bearish case?
$DIA $SPY $QQQ $IWM
We already know the market is waiting on CPI and the Fed so I’ll get straight to the charts.
If you missed that part, read this from Wednesday.
https://www.trading-adventures.com/p/waves-and-cycles
$SPY — Not quite an inside day. But it is 3 days well inside of Tuesday’s range.
Waiting.
The 8-day is pushing down a bit and at the close, it is also below the 21-day.
$QQQ — Similar situation; a tight range for three days and now just under the 8/21-day EMAs.
$IWM — Continues to be relatively weak. It breached Tuesday’s low and closed on the 50-day.
$DXY — No harm from the Dollar this week.
$VIX — Volatility is staying fairly subdued.
The Bull Case is very straightforward.
$SPY must stay above 390 and resume movement back towards 410 and beyond.
The Bear Case is simply the opposite.
Below $SPY 390 and we’re looking back to 370 and 350.
Consensus says CPI and The Fed next week will be the catalyst.
The near-term direction will depend on those reports.
It's very important to be ready for a move in either direction.
Go here for
🔹Bigger picture with the weekly charts
🔹To get further prepared for next week
🔹Form a plan for whichever direction the market decides to move
https://twitter.com/Andy__Moss/status/1601574104678944768
For more charts and market moves -- like and retweet this thread.
And subscribe here
andy_moss
4y ago
🟢 Weekend Market Prep 🟢
$SPY is down three weeks in a row and below the June lows. You need to have a plan.
Look here for some ideas. 👇
Hurricane Week!
Fiona hit Puerto Rico and Ian hit Florida. I hope all of you and your families are safe and relatively undamaged. Sadly, I know many are not.
Ian and Fiona weren’t the only storms brewing as the market felt a bit precarious coming into the week.
The indexes tried to hold up but weakened into the close Friday. Not a great end to the week/month/quarter.
Each day that we don’t make upward progress is a day that adds fuel to the bearish fire.
So far the "bounce" story leaves much to be desired. Price action just isn’t supporting it. In fact, the indexes have been in a bearish consolidation pattern, working off the downside extension and allowing the short-term moving averages to catch up (down?) to price.
That looks more like continuation than reversal.
The overall trend is still down. While a bounce would be very welcomed by the bulls, it would still be a counter-trend move and would need to be treated as such.
Here are the charts-
$SPY - not a bullish finish to the week
$QQQ - looking vulnerable
$IWM - A possible bear flag pattern here gives a measured move target of around the $144 price area.
$DXY - The Dollar did come down this week which gave the bulls some hope. So far it hasn’t been enough.
$VIX - Implied volatility is still elevated and may want to go higher still.
The bull and bear case here is very simple.
Do we break above this potential island bottom, stay above, and move higher?
Or do we break down from the bearish consolidation and keep going lower?
Flushing into the close on Friday isn’t bullish.
This week watch $SPY 372.30 on the upside. Seems like a tall order.
On the downside, with prices below the June lows, we have to look further for potential support. The pre-covid high in the area of 340 could be a spot.
See this thread for monthly charts and a bigger-picture view.
https://twitter.com/Andy__Moss/status/1576180458877964290
As bad as the charts look, a bounce of some sort isn't out of the question.
To know what to look for read
this - Could We See a bounce?
and this - A Look at Mid-Term Election Years
andy_moss
4y ago
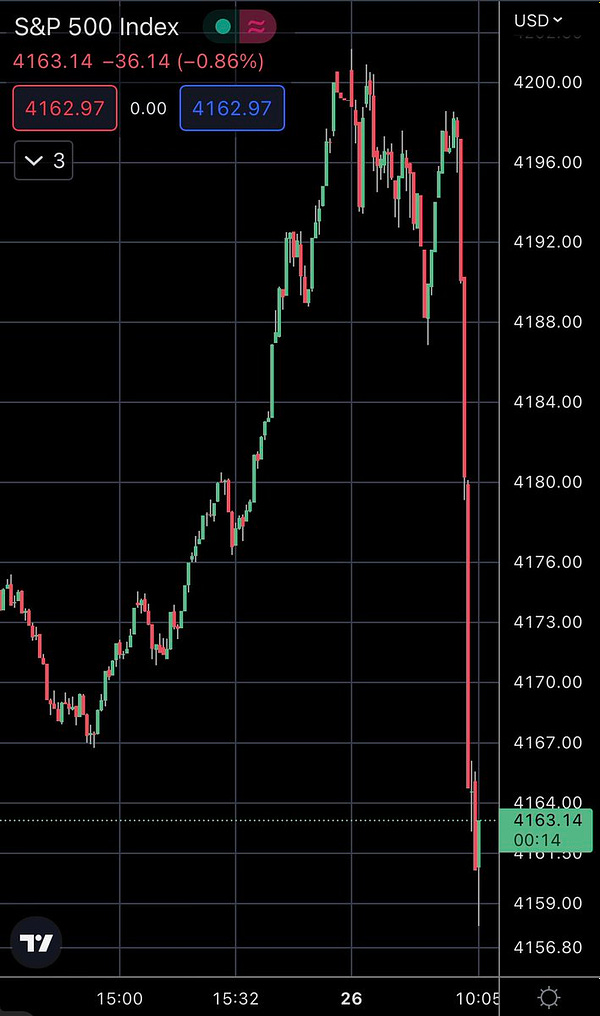
Nasty selloff after Jay Powell addressed the conference in Jackson Hole
Jackson, WY USA - December 24, 2020: Rafting bears are among the many whimsical outdoor displays decorating local shops in the year-round resort town of Jackson in Wyoming.
His comments were hawkish indicating the Federal Reserve will continue to tighten economic conditions by raising rates further.
Not exactly surprising. Still, the impact on the market was sharp and immediate.
Do you think people were waiting to see what he had to say?
@RampCapitalLLC
I wonder when he started talking
A precarious predicament
So where does that leave us? Much more bearish looking than this time a week ago.
From last week’s review -
The S&P 500 has been very strong but this week couldn’t get over the 200-day MA. It’s now resting on the volume-weighted price anchored to the all-time highs (ATH AVWAP). The bull case is to hold and bounce from $420 as that's been such a heavily watched level. Below that watch for a move to test the 21-day EMA, and if that doesn't hold $410 may help.
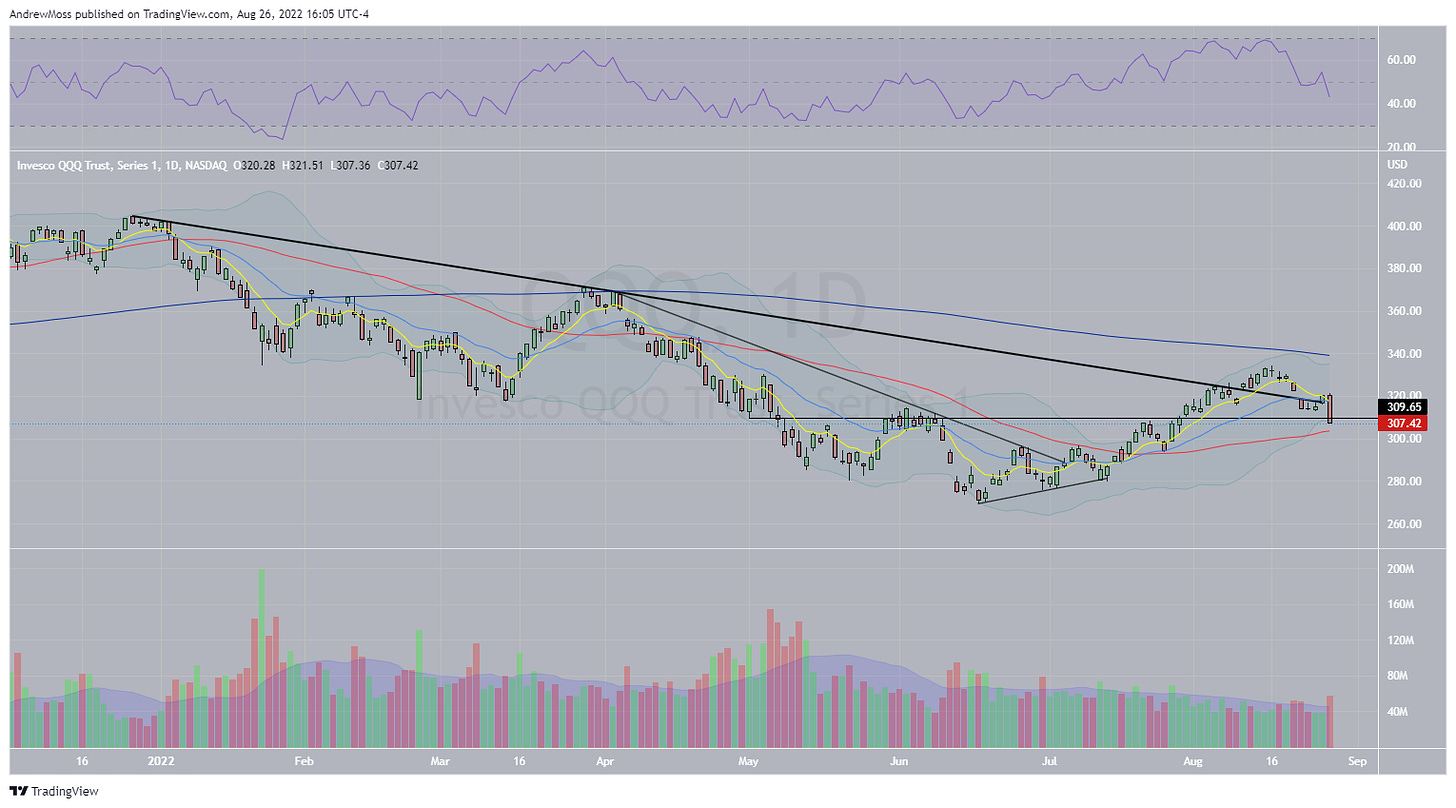
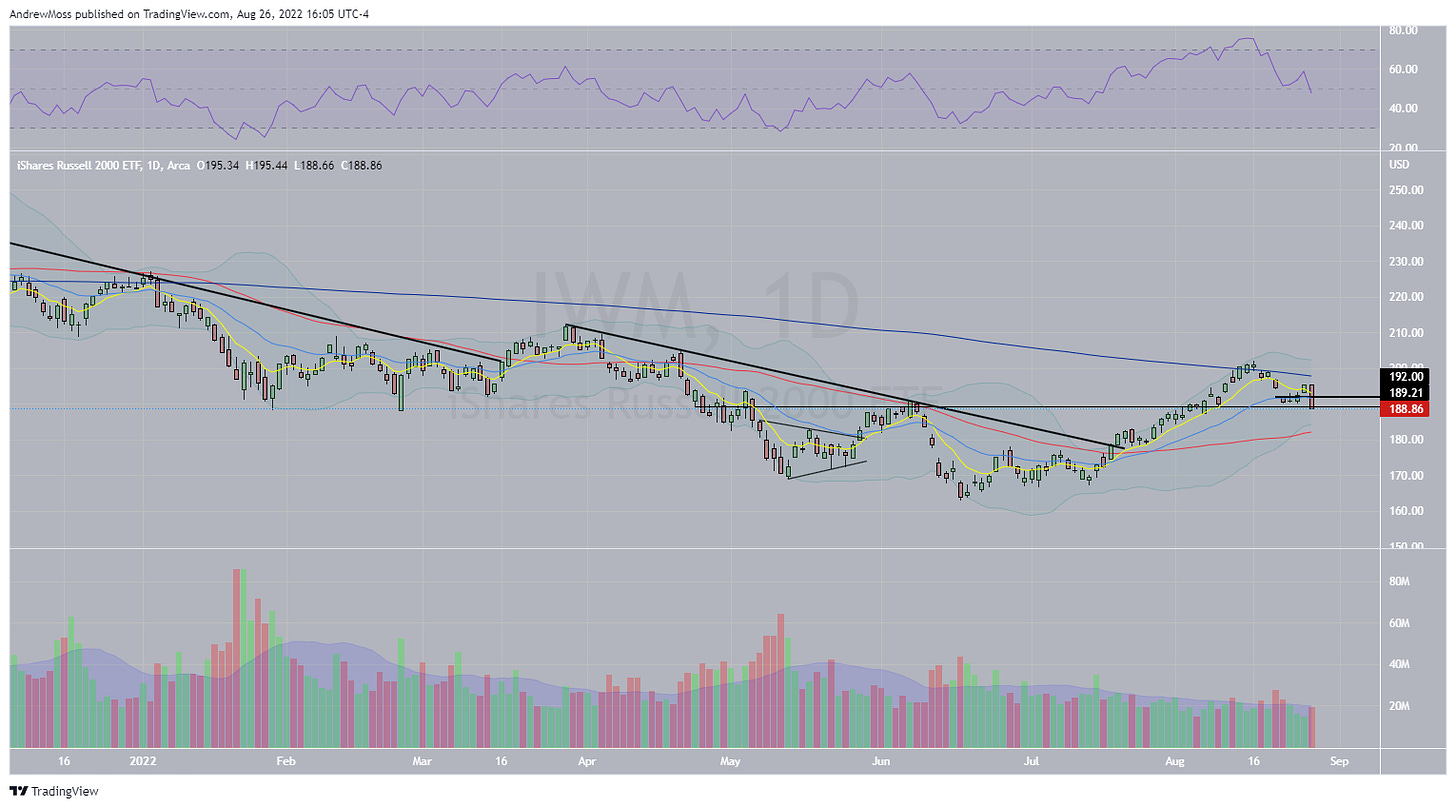
So here we are, looking up at SPY 410, QQQ 310, and IWM 190.
Not bullish.
Can prices find support and resume the move higher?
Or do they break lower signaling “risk off” once again?
You don’t need to be a technical analyst or a chartist to see things are pointing lower.
Even if support does hold, today’s action results in a very ominous-looking red candle. Getting above the high of today negating this candle will be the first order of business for the bulls. The sooner it happens (if it can happen) the better.
Down below, we’re looking at the 50-day moving averages, then the July 26 pivot, and finally the June 16/17 low as potential support.
$SPY

$QQQ
$IWM
$VIX up over 17% today ⚠

$DXY looking for a breakout

Quite a nasty day
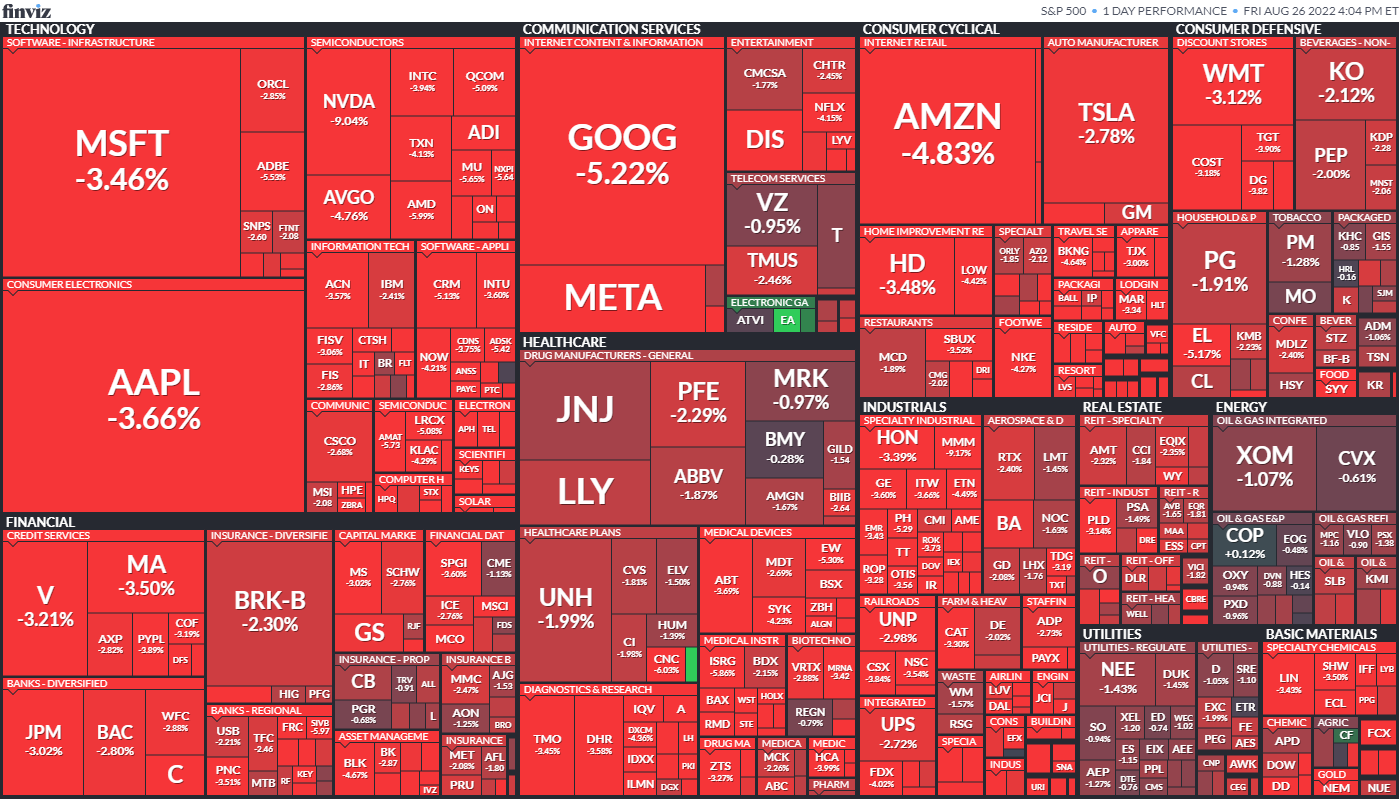
As always; know your time frames and no your outs.
Risk management is critical in markets like this.
And don’t get in a hurry.
#Patience
@tradingview
Kurt Vonnegut is one of my favorite authors. And by all accounts (that I’ve read anyway) a nice and funny guy.
Slaughterhouse-Five
The Sirens of Titan
If This Isn't Nice, What Is?: Advice for the Young
Harrison Bergeron
Great place to start if you haven’t read them yet.
This story is more great advice for young people.

And while we’re talking about writing…
Thanks for reading. If you haven’t subscribed, do that now. And if you haven’t shared this with a co-worker, friend, or family member yet I would really appreciate it if you did.
As usual, I will be on Twitter tomorrow morning with a look at some weekly charts. Come chime in and let me know what you’re looking for or what charts you’d like to see.
***This is NOT financial advice. NOT a recommendation to buy, sell, or trade any security. The content presented here is intended for educational purposes only.
Andrew Moss is an associated member of T3 Trading Group, LLC (“T3TG”) a SEC registered broker/dealer and member of FINRA/SIPC. All trades placed by Mr. Moss are done through T3TG.
Statements in this article represent the opinions of that person only and do not necessarily reflect the opinions of T3TG or any other person associated with T3TG.
It is possible that Mr. Moss may hold an investment position (or may be contemplating holding an investment position) that is inconsistent with the information provided or the opinion being expressed. This may reflect the financial or other circumstances of the individual or it may reflect some other consideration. Readers of this article should take this into account when evaluating the information provided or the opinions being expressed.
All investments are subject to risk of loss, which you should consider in making any investment decisions. Readers of this article should consult with their financial advisors, attorneys, accountants or other qualified investors prior to making any investment decision.
andy_moss
4y ago
Monday markets - how'd we start?
Not great. I'll sum it up with just a few charts.
$SPY - apparently people were watching the 200-day MA.
$QQQ back under the trendline
$VIX up
$DXY Dollar up
I've got to agree with @allstarcharts here. A rising Dollar is a headwind for stocks. Without some relief, it will be harder for stocks to get back to highs. After 8 strong days maybe there will be some resistance at recent highs.
Maybe.
https://twitter.com/allstarcharts/status/1561677746769649670
andy_moss
4y ago
Welcome to this week's edition of the Weekend Market Review.
This week started of a bit shaky as the action on Monday left the $SPY $QQQ and $IWM all putting in potential reversal candles just ahead of some resistance.
Tuesday gave some follow-through and confirmation of the reversal, but it never felt especially powerful as it was becoming clear that there wouldn't be any serious moves by traders until after the CPI report came out Wednesday morning.
This worked out well with expectations. If you recall from last weekend's review -
"The bull case from here would be another day or two of price consolidation just below these resistance levels followed by a break higher sometime next week."
That's exactly what we got. The CPI number came in a bit lighter than previously expected and the fuse was lit. From the Tuesday low to the Friday high the $SPY advanced +4.10%.
$SPY -- $417 resistance is behind us for now, as is the ATH AVWAP, and all eyes are on $429-$430 and then the downward sloping 200-day SMA at $431.83. Add one more factor in the form of a downtrend line and next week could have several challenges for $SPY bulls.
$QQQ - NASDAQ 100 has a similar situation
$IWM - Over the $200 psychological level, as well as the ATH AVWAP and the 200 Day SMA
$VIX -- continued its very orderly decline
$USD -- The dollar also still provides some relief as it moves lower from this trendline
$USO -- Oil is bucking the relief trend a bit as we see the potential bear flag that was setting up on the daily chart has been negated.
With the CPI report behind us, and earnings season slowing down a bit, next week is likely to be a little more subdued. And conventional thinking says the market has got to take a rest somewhere along the way. But as always, we never know what's next. So just keep watching the charts and riding the trends while they are here.
I will be traveling to a family reunion this weekend so weekly charts will go on Twitter Sunday instead of Saturday. Be sure to head to https://twitter.com/Andy__Moss to catch them.
Now here are a few notes from the week to close.
Have a great weekend!
My week on Twitter
Baseball is fun. #Toastman makes it even funner
https://twitter.com/Andy__Moss/status/1557152967408488450
Choppy action and misdirection
$RBLX tanked on earnings only to bounce back and finish green
https://twitter.com/Andy__Moss/status/1557487675392786432
$INTC broke down through what looked like major support and then came back up the next day
https://twitter.com/Andy__Moss/status/1557024760772558854
Some things I’ve been Reading, Watching, and Listening to:
#90 Linda Raschke: Trading and ‘The Power of The Mind’
https://www.thealphamindpodcast.com/90-linda-raschke-trading-and-the-power-of-the-mind/
https://twitter.com/AlphaMind101
TONY NADER: WHAT IS THE MEANING OF LIFE?
https://www.chasejarvis.com/blog/tony-nader-what-is-the-meaning-of-life/
https://twitter.com/chasejarvis
The Case for Traveling More
https://www.youngmoney.co/p/case-traveling
https://twitter.com/Jack_Raines
***This is NOT financial advice. NOT a recommendation to buy, sell, or trade any security. The content presented here is intended for educational purposes only.
Andrew Moss is an associated member of T3 Trading Group, LLC (“T3TG”) a SEC registered broker/dealer and member of FINRA/SIPC. All trades placed by Mr. Moss are done through T3TG.
Statements in this article represent the opinions of that person only and do not necessarily reflect the opinions of T3TG or any other person associated with T3TG.
It is possible that Mr. Moss may hold an investment position (or may be contemplating holding an investment position) that is inconsistent with the information provided or the opinion being expressed. This may reflect the financial or other circumstances of the individual or it may reflect some other consideration. Readers of this article should take this into account when evaluating the information provided or the opinions being expressed.
All investments are subject to risk of loss, which you should consider in making any investment decisions. Readers of this article should consult with their financial advisors, attorneys, accountants or other qualified investors prior to making any investment decision.
andy_moss
4y ago
Good morning Twitter. Weekly chart time.
Some ranges and potential resistance levels coming in view.
Starting w/ the futures
S&P 500
NASDAQ 100
RUSSELL 2000
US DOLLAR
$VIX
$AGG
Bitcoin $BTCUSD
$XLF support/resistance line is the 2007 pre-GFC high
$XLE
$USO
$UGA
$XME
Now some individual names
$AMZN
$AAPL
$TSLA
$AMD
$GOOGL
$MSFT
$NVDA
Stage shift? Or too early to tell?
$PYPL
$DKNG
$SHOP
That's all for now. Off to the soccer fields for a work party.
Let me know what you see. And read my weekly market review here. 👇
https://andrewmoss.substack.com/p/852022-weekly-market-review
andy_moss
4y ago
It was a mostly up week in the markets as these changing trends continued. The general opinion seemed to focus on the possibility of the Fed slowing the pace of rate increases.
That changed Friday morning as the jobs report showing very low unemployment put a dampener on things.
Good news is bad news again?
The interpretation is that the Fed will have to continue to raise rates aggressively. After the open most things staged a massive morning rally taking prices back near resistance before heading down to make new lows for the day. Choppy, range-bound action, which isn't a terrible thing to see after the multi-week move higher.
The bull case from here would be another day or two of price consolidation just below these resistance levels followed by a break higher sometime next week.
The bear case is a move below the 8-day EMA. This could lead to lower prices pretty quickly as things are a bit extended here.
$SPY pause at 417 resistance
$QQQ in a bit of a wider zone between 315-330
$IWM almost touched 190.94 resistance before heading lower.
The US Dollar is bumping into this support/resistance line with no real clear direction yet.
I'll share a look at some weekly charts on Twitter tomorrow.
And in case you missed them, here are some thoughts I shared over there throughout the week.
This chart caught some eyes— Many stock charts look similar to this suggesting the possibility of a move out of Stage 4 decline and into Stage 1 accumulation.
This image looks very familiar 🤔 $SHOP
The familiarity comes from Brian Shannon’s chart on Understanding Market Structure
www.alphatrends.net
Trading systems don’t need to be complicated
Some things never change
Some things I’ve been Reading, Watching, and Listening to:
Edward Thorp on the Tim Ferriss Show
Edward Thorpe on the @tferriss show open.spotify.com/episode/4e3F7a…
Ed Thorp was on the Tim Ferriss show recently sharing some thoughts and stories. He is truly a fascinating guy and a brilliant thinker. He's written books on blackjack “Beat the Dealer,” and investing “Beat the Market: A Scientific Stock Market System,” developed the first wearable computer, and been a very successful hedge fund manager.
The books listed are worth the time. If you want a preview or a condensed version of his story this is a great interview.
Tom Canfield on the TraderLion Trading Conference
Tom Canfield is a full-time independent trader and CEO of BeDumbFollowPrice.com. His stories of trading success, struggle, and perseverance are a "must listen" for active traders. In this conversation with Richard Moglen of TraderLion Tom shares candid views of what life as a trader is really like.
Walter Deemer - There are no atheists in a bear market
My Twitter Spaces with the legendary @gnoble79:
Walter Deemer - There Are No Atheists in Bear MarketsRecorded July 21, 2022.Donate generously to World Central Kitchen ➡️ https://donate.wck.org/fundraiser/3816260 Listeners have been asking how they can show t...youtube.com
Walter Deemer is always good for a solid technical opinion on the markets and a good chuckle to go along with it. His book “When the Time Comes To Buy, You Won’t Want To: Timeless Pieces of Wit and Wisdom Compiled by a Wall Street Legend” is a compendium of his clever Wall Street sayings.
Some gems from this interview conducted by George Noble:
Ours is not to reason why, Ours is just to sell or buy
When the time comes to buy, you won't want to.
If you want to watch CNBC like the pros, turn the sound off.
Just when you find the key to the stock market some SOB comes along and changes the locks.
Walter is also a founding member and past president of the Chartered Market Technicians Association, former head of Putnam Investments' Market Analysis Department, founder of Deemer Technical Research Inc., author of several other books, and a fantastic Twitter follow.
That’s it for now. Thanks for reading this week’s Trading Adventures market review. Let me know what you think by clicking the button ☝
Your readership, subscriptions, and shares are truly appreciated.
I’ll be on Twitter over the weekend with some weekly charts.
See you there.
***This is NOT financial advice. NOT a recommendation to buy, sell, or trade any security. The content presented here is intended for educational purposes only.
Andrew Moss is an associated member of T3 Trading Group, LLC (“T3TG”) a SEC registered broker/dealer and member of FINRA/SIPC. All trades placed by Mr. Moss are done through T3TG.
Statements in this article represent the opinions of that person only and do not necessarily reflect the opinions of T3TG or any other person associated with T3TG.
It is possible that Mr. Moss may hold an investment position (or may be contemplating holding an investment position) that is inconsistent with the information provided or the opinion being expressed. This may reflect the financial or other circumstances of the individual or it may reflect some other consideration. Readers of this article should take this into account when evaluating the information provided or the opinions being expressed.
All investments are subject to risk of loss, which you should consider in making any investment decisions. Readers of this article should consult with their financial advisors, attorneys, accountants or other qualified investors prior to making any investment decision.
andy_moss
4y ago
It's been a busy week!
Many thanks for all the new follows, retweets, and comments.
Twitter is such a great place full of unique and helpful communities.
#FinTwit and #ChartTwit are the best!
Here are some of my more active tweets the last week or so
https://twitter.com/Andy__Moss/status/1552349980987461635
https://twitter.com/Andy__Moss/status/1551297462912139275
https://twitter.com/Andy__Moss/status/1543743933242548225
https://twitter.com/Andy__Moss/status/1545425988133306369
https://twitter.com/Andy__Moss/status/1545806429487087617
Once again, thanks for all the conversation and interaction. Engagement really does matter.
And if you're on this list know that I truly appreciate what you're doing.
I'm enjoying the journey and learning from all of you.
🙏🙏🙏
andy_moss
4y ago
July 18, 2022 market review
On July 9th $QQQ was breaking above the downtrend line.
https://twitter.com/Andy__Moss/status/1545806429487087617?s=20&t=52CQoa8t2g_ekDBTsw7tjw
The next day it poked through resistance. And in the following days, it moved back down to retest the downtrend line, which has now flipped from resistance to support.
Today it moved up through $295 resistance again. And it got rejected, again. A point for the bears.
This chop can be frustrating, but it is completely normal price action in this environment. Bear market rallies often have trouble sustaining and are very prone to failure and/or misdirection.
Is it part of the bottoming process? It could be. But it could also be a rest in the action before selling pressure increases again.
No one really knows until well after the fact. But there are some other charts to watch for potential clues.
In that same article, I pointed out that $SPY was lagging $QQQ and hadn't even made it to the down-trend line yet.
SP Futures got there today but didn't stay long. Another point for the bears.
$AAPL moved past the first resistance line at $147.74 and right into the next one at $151.49 before news of a hiring slow down ignited selling pressure that sent it back down almost to the 8-day EMA. No point, bulls or bears.
$WOLF had a similar move. And I see many more examples of this in the charts this evening.
https://twitter.com/Andy__Moss/status/1549122259612094464?s=20&t=52CQoa8t2g_ekDBTsw7tjw
The point of all of this is to show that levels matter. Price has memory. Areas of potential support and resistance are worth knowing. It's not a silver bullet; that's why it's called "potential" support or resistance. But I'd wager that it comes into play more often than not.
So keep reviewing your charts (and mine if you're finding them helpful) and know your levels and your timeframe. It's still very much a "wait and see" market as far as I'm concerned.
What do you think? Let me know in the comments.